
Table of Contents
Time Series Forecasting
A time series is a series of data points collected at regular intervals, such as daily, monthly, or quarterly sales, or weekly or monthly temperatures. We can see how values change over time by analyzing time series data and making informed predictions. Time series forecasting is a valuable tool used in many fields. Companies use it to predict future sales or stock prices, which helps with inventory management and planning. Financial models rely on time series to estimate revenue, expenses, or cash flow, which guides budgeting and investment decisions. Weather forecasts use time series to predict temperature, rainfall, and other weather patterns. Economists analyze time series to understand economic trends and market dynamics. Time series forecasting has a broad range of applications, making it useful for data analysts, business professionals, and students in data science. Forecasting models are powerful tools that accurately spot patterns, track changes, and predict future trends. By using time series forecasting, organizations learn from past data to estimate what might happen in the future. This helps them make better decisions and feel more confident in their strategies and plans.
Statistical Models versus Machine Learning Models
There are two main approaches to time series forecasting: statistical models and machine learning models. Statistical models describe data features using mathematical formulas. They identify patterns, such as trends and seasonality, which are regular changes that occur at specific intervals. Statistical models are easier to understand and work with because they rely on a fixed structure. Machine learning models work differently; they don’t use predefined rules or equations. Instead, they learn patterns and relationships from historical data, which traditional methods often can’t identify. Machine learning algorithms aim to reduce prediction errors through iterative learning, making them well-suited for large, complex datasets that undergo unexpected changes.
Machine learning algorithms are particularly effective when data has complex relationships or additional features, such as external factors, that can improve predictions. Statistical models remain strong choices for datasets with clear trends or well-defined seasonality, due to their simplicity and ease of interpretation. However, machine-learning models are the best option for very large or complex datasets or those with many influencing factors. You can use various tools and programming languages for time series forecasting. The most common ones are Python, R, and MATLAB, all of which have strong libraries for time series analysis.
We can also use mixed methods to forecast time series, combining statistical and machine learning models.
To make forecasting easy, you can also use AutoML or Automated Machine Learning, which automates the time-consuming tasks of developing machine learning models. It tests different models for a dataset and selects the best one, saving time and maintaining accuracy. AutoML systems evaluate several models and configurations, helping users apply the latest forecasting techniques with minimal manual setup.
Testing Models.
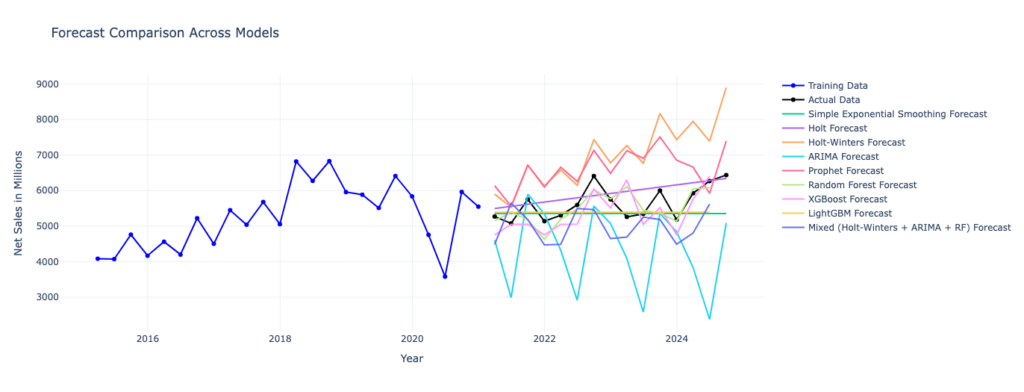
The graph below shows the results of different time-series forecasting models using Adidas’s quarterly net sales data. I need to determine which model will give the best results for forecasting Adidas’ sales data over the next few years. One way to do this is by using an AutoML cloud service, like Microsoft’s Azure AutoML. I would upload the data in a tabular format and let the system automatically pick the best models. Alternatively, I can use Python and run some code to test and identify the best models for forecasting my data.
Since I don’t have the future data (Adidas’s quarterly sales from 2025 to 2029), it’s challenging to test the models directly. To work around this, I can split my existing data to assess the models. For example, I could use Adidas’s quarterly net sales data from 2015 to 2024. Using different statistical and machine learning models, I will use data from 2015 to 2020 as the training set and attempt to forecast sales for the years 2021 to 2024.
The graph below shows the actual data in black and the outcomes of various models in different colors. The Random Forest model (in light green) appears to be the best, as its line is the closest to the black line representing the actual data.
To assess which model performed the best, I need to calculate the Root Mean Squared Error (RMSE). This will show how much the forecasted values deviate from the actual data. The Root Mean Squared Error (RMSE) is a metric that quantifies the average magnitude of errors between predicted and actual values. It’s calculated by taking the difference between the exact data and the forecasted values, squaring these differences to ensure they’re all positive, averaging the squared differences, and then taking the square root of the result. RMSE gives us a precise measure of how much, on average, the model’s predictions deviate from the actual values. The lower the RMSE, the better the model’s performance.
RMSE is a metric used to measure the difference between predicted values and actual values. To calculate RMSE, use the following formula:
Where:
- \( y_i \) is the actual value at time \( i \)
- \( \hat{y}_i \) is the forecasted value at time \( i \)
- \( n \) is the number of data points
RMSE Calculation for Models
The graph below shows the RMSE for various forecasting models.
The bar chart shows that the Random Forest model’s Mean Squared Error (MSE) is 147,314.63. Taking the square root of this value gives us the Root Mean Squared Error (RMSE), which is approximately 383.79 million dollars. This means that, on average, the model’s predictions are off by about 384 million dollars compared to the actual sales data.
To learn more about time series models, please look at this notebook: https://colab.research.google.com/drive/1Bi4M8HUkSpZeEiShGN_JgH4_jQY1P4C1?usp=sharing